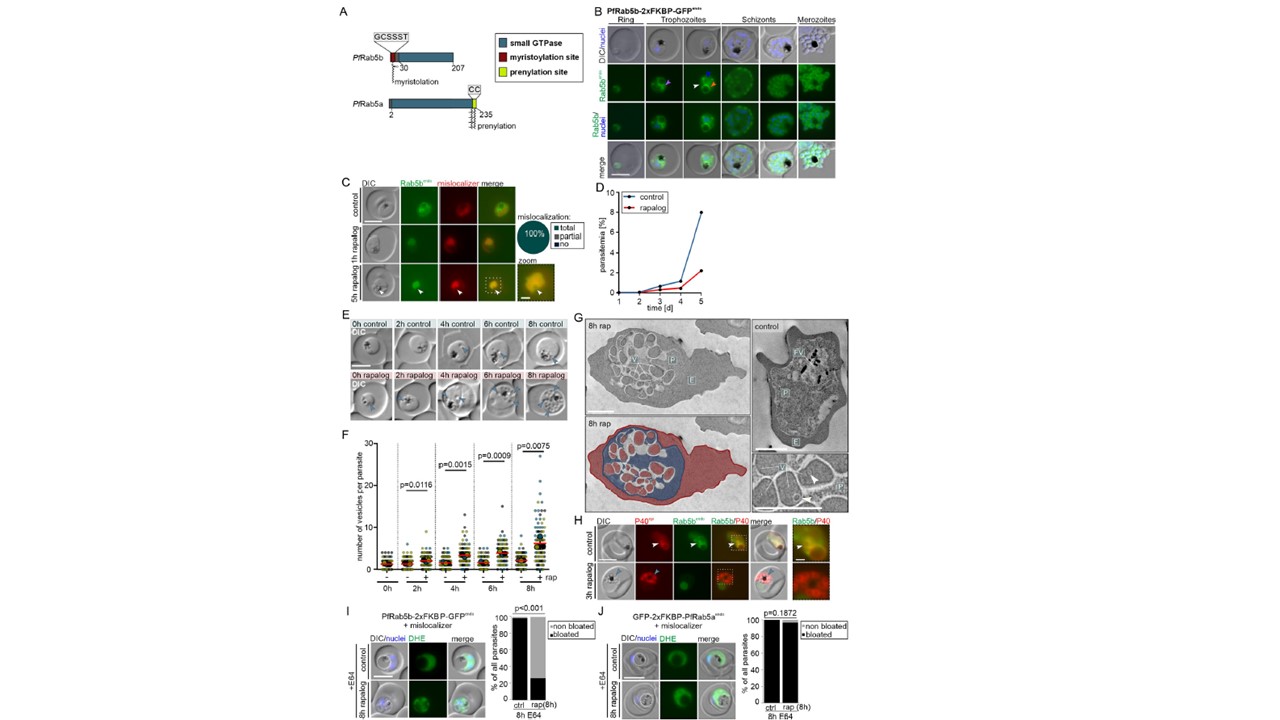
PfRab5b is needed for host cell cytosol uptake. (A) Domain architecture of P. falciparum Rab5b and Rab5a. (B) Live-cell microscopy images of the indicated stages of PfRab5bendo parasites. Orange arrow: signal at the food vacuole, purple arrow: circular signals adjacent to the food vacuole, white arrow: signal at the plasma membrane, blue arrow: ER localization. (C) Live-cell images of PfRab5b knock-sideways (1 h and 5 h rapalog) and control parasites. Knock-sideways was classified (pie chart) as complete (no signal detected outside the nucleus), partial (signal in the nucleus but also at original site), or absent (no) mislocalization in n = 55 parasites from 3 independent experiments. Zoom, enlargement of boxed region. (D) Flow cytometry-based growth curve over 2.5 growth cycles of PfRab5b knock-sideways (rapalog) compared to the control. One representative of n = 3 independent experiments, all replicas shown in (S1G Fig). (E) Representative DIC images of live parasites 0 h, 2 h, 6 h, and 8 h after induction of knock-sideways of PfRab5b (rapalog) compared to control. Arrows, vesicular structures. (F) Quantification of number of vesicles per parasite in synchronous trophozoites 0 h, 2 h, 6 h, and 8 h after induction of PfRab5b knock-sideways. Data shown as superplots from n = 3 independent experiments (individual experiments are in blue (n = 306 parasites), yellow (n = 306 parasites), and black (n = 306 parasites) (small dots), respectively; average of each experiment as large dot); two-tailed unpaired t test of the means, p-values indicated; mean (red bar); error bars (black) show SD. (G) Electron microscopy images of PfRab5b knock-sideways (8 h rap) and control parasites. Bottom left shows the image from top left with false coloring. E, erythrocyte (red); P, parasite (blue); FV; food vacuole (yellow); V; vesicular structure (red). White arrows: putative intraluminal bodies. (H) Live-cell images of knock-sideways of PfRab5b (3 h rapalog) and control parasites, co-expressing mScarlet-tagged PI3P marker P40 (P40epi). White arrows: PI3P positive structures adjacent to the FV. Blue arrows: accumulations of PI3P near the FV over time. The image on the right shows enlargement of the boxed region. (I, J) Live-cell images of PfRab5b (I) and PfRab5a (J) knock-sideways (8 h rapalog) treated 8 h with E64. Left: Live-cell images of DHE-stained parasites. Dashed circle highlights FV. Right: Quantification of the number of cells with bloated FVs. Fisher’s exact test. Pooled from n = 3 independent experiments (PfRab5b: 34, 34, and 34 cells (control) and 34, 34, and 34 cells (rapalog); PfRab5a: 23, 22, and 33 cells (control) and 22, 26, and 13 cells (rapalog)). P-values indicated. Scale bars in fluorescence microscopy images are 5 μm and 1 μm in enlargements and 2 μm in electron microscopy images. Nuclei in B, I, and J were stained with DAPI. DIC, differential interference contrast; endo, endogenous; epi, episomal; PfRab5bendo C-terminally and Rab5aendo N-terminally tagged with 2xFKBP-GFP expressed from endogenous locus. Sabitzki R, Roßmann AL, Schmitt M, Flemming S, Guillén-Samander A, Behrens HM, Jonscher E, Höhn K, Fröhlke U, Spielmann T. Role of Rabenosyn-5 and Rab5b in host cell cytosol uptake reveals conservation of endosomal transport in malaria parasites. PLoS Biol. 2024 22(5):e3002639.
Other associated proteins
| PFID | Formal Annotation |
|---|---|
| PF3D7_0211200 | ras-related protein Rab-5A |
| PF3D7_1310600 | ras-related protein Rab-5B secretory complex protein 61 alpha |
