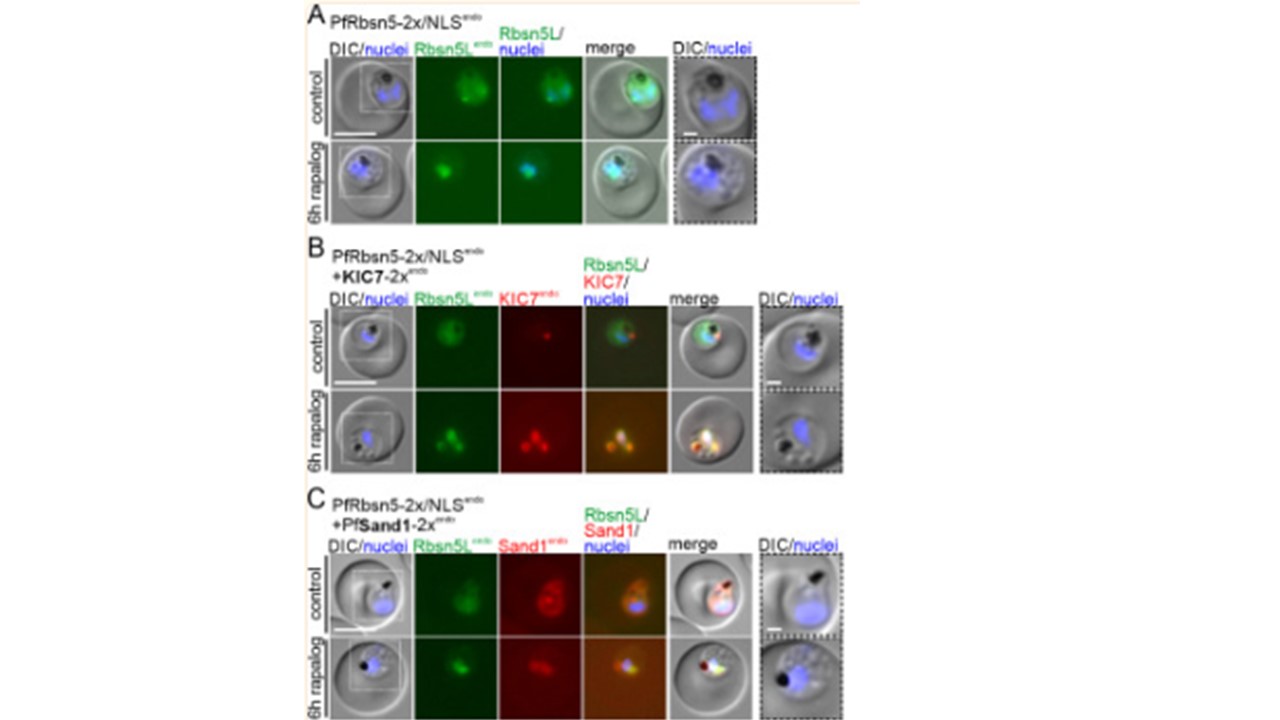
Inactivation of PfRbsn5L or cytochalasin D treatment together with KIC7 inactivation leads to reduced vesicle accumulation.
(A–C) Knock-sideways (6 h rapalog) of highly synchronous parasites (30–33 h post invasion) of PfRbsn5L-2x/NLSendo (using cell line PfRbsn5L-2xFKBP-GFP/NLS-FRBendo), PfRbsn5L-2x/NLSendo+ KIC7-2xendo (using cell line PfRbsn5L-2xFKBP-GFP/NLS-FRBendo+ KIC7-2xFKBP-mChendo), and PfRbsn5L-2x/NLSendo+ PfSand1-2xendo (using cell line PfRbsn5L-2xFKBP-GFP/NLS-FRBendo+ PfSand1-2xFKBP-mChendo) and control (without rapalog) parasites. Nuclei were stained with DAPI. DIC, differential interference contrast. Dashed boxes in the images are areas shown as magnification on the right. Scale bar, 5 μm. (D, E) Superplots showing quantification of the vesicle number per parasite (D) and parasite diameter (E) of the cells shown in A–C. Data from n = 3 (PfRbsn5L-2x/NLS endo) or n = 4 (PfRbsn5L-2x/NLSendo+ KIC7-2xendo and PfRbsn5L-2x/NLSendo + PfSand1-2xendo) independent experiments. PfRbsn5L-2x/NLSendo: 21 (gray dots), 31 (yellow dots) and 30 (blue dots) cells (control) and 23, 30, and 24 cells (rapalog), PfRbsn5L-2x/NLS endo + KIC7-2xendo: 15 (black dots), 19 (gray dots), 18 (yellow dots), and 19 (blue dots) cells (control) and 21, 20, 22, and 35 cells (rapalog), and PfRbsn5L-2x/NLS endo + PfSand1-2xendo: 14 (black dots), 16 (gray dots), 13 (yellow dots), and 9 (blue dots) cells (control) and 20, 12, 9, and 26 cells (rapalog), respectively. Small dots represent 1 parasite, large dots the mean of each independent experiment; two-tailed unpaired t test of the means, p-values indicated; mean (red); error bars (black) show SD. Scheme besides D shows expected outcome if cytostome (top) function generates endosomal cargo needing Rbsn5L for transport (bottom). (F, G) Superplots showing quantification of the number of vesicles in PfKIC7endo + NLS parasites (F) and diameter of these parasites (G). Data from n = 3 independent experiments. Control: 22 (gray dots), 32 (yellow dots), and 27 (blue dots) cells; rapalog: 26, 32, and 27 cells; cytochalasin D: 26, 32, and 27 cells; rapalog and cytochalasin D: 26, 29, and 27 cells. Small dots represent 1 parasite, large dots the mean of each independent experiment; two-tailed unpaired t test of the means, p-values indicated; mean (red); error bars (black) show SD. Scheme besides F as in D. Sabitzki R, Roßmann AL, Schmitt M, Flemming S, Guillén-Samander A, Behrens HM, Jonscher E, Höhn K, Fröhlke U, Spielmann T. Role of Rabenosyn-5 and Rab5b in host cell cytosol uptake reveals conservation of endosomal transport in malaria parasites. PLoS Biol. 2024 22(5):e3002639.
Other associated proteins
| PFID | Formal Annotation |
|---|---|
| PF3D7_1310300 | zinc finger protein, putative |