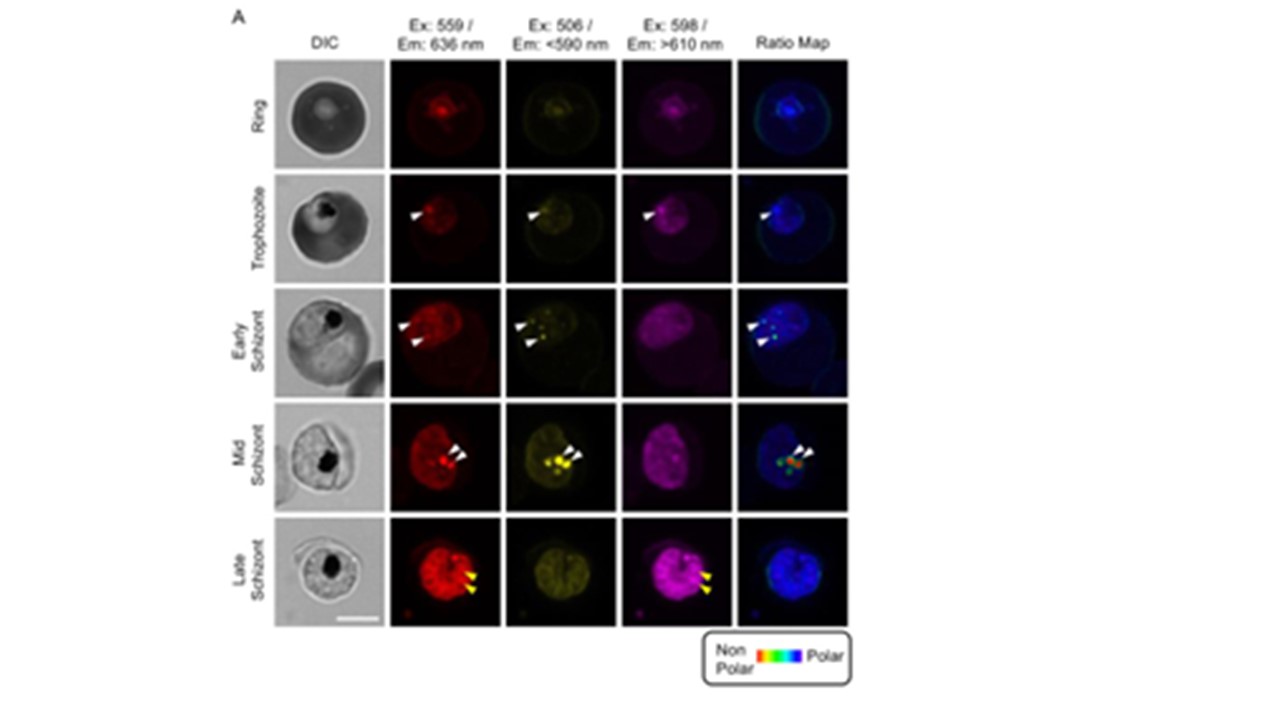
Differentiating polar and non-polar lipids in Nile red stained P. falciparum infected red blood cells. (A) Representative confocal images of Nile Red-stained parasite infected red blood cells, employing different excitation and emission settings on ring (shortly after invasion; n=66), trophozoite (1 nucleus; n=70), early schizont (2-5 nuclei; n=60), mid schizont (>6 nuclei without fully segmented merozoites; n=60), and late schizont stages (>20 nuclei; with segmented daughter cells; n=30). Differential Interference Contrast (DIC) images of parasitised RBCs are depicted in the first column, Nile Red fluorescence signal under traditional settings are depicted in red (excitation: 559nm/ emission: 636nm; second row), non-polar (e.g. TAG) lipid-enriched features are depicted in yellow (excitation: 506nm/emission: 520-590nm; third row), polar lipids (e.g. phospholipids) are depicted in magenta (excitation: 598nm /emission: 610-750nm, forth row) and a ratio map is depicted in the far right column. The ratio images, created by dividing yellow (non-polar) intensity by magenta (polar) intensity, is presented in a rainbow scale. Regions closer to the blue end of the spectrum indicate higher polarity, whereas those shifted towards the red end signify lower polarity. All images, except DIC, are maximum intensity projections. White arrowheads: LDs; yellow arrowheads: polar lipid accumulations in individual merozoites. Scale bar: 5µm. Lee J, Matuschewski K, van Dooren G, Maier AG, Rug M. Lipid droplet dynamics are essential for the development of the malaria parasite Plasmodium falciparum. J Cell Sci. 2024 15;137(20):jcs262162. PMID: 38962997.