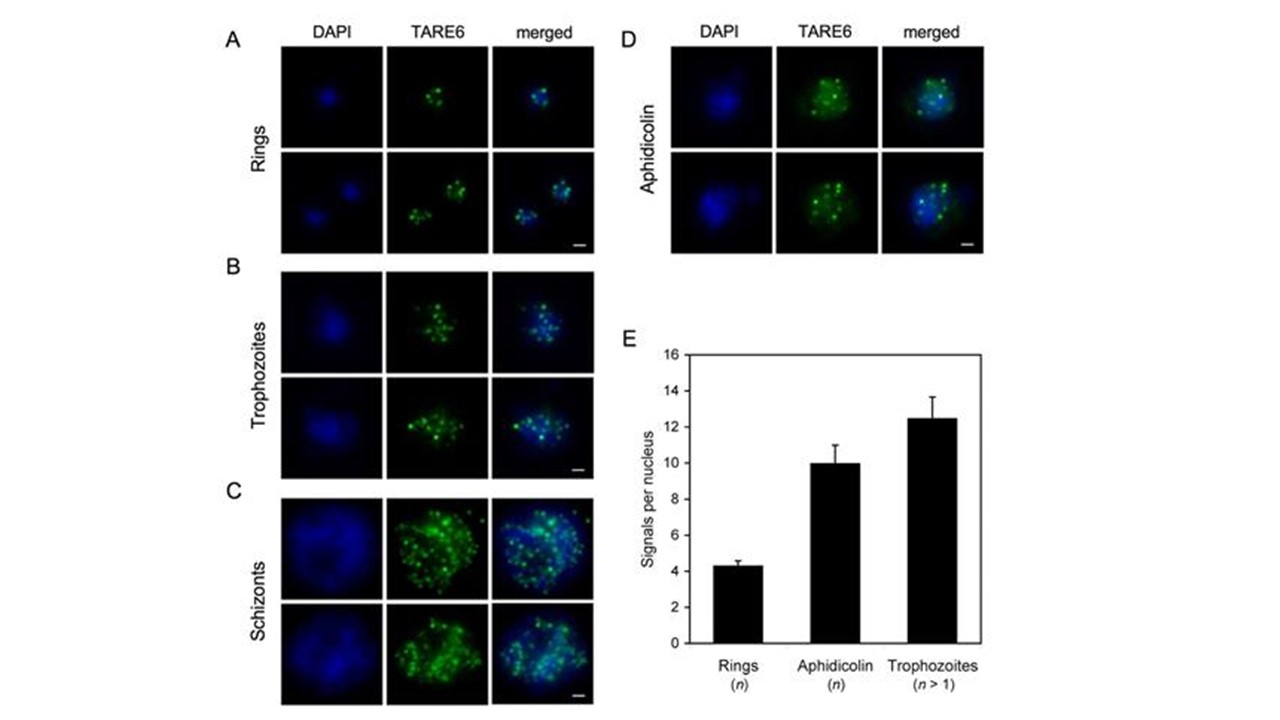
Visualization of the telomeric clusters during the blood-stage cycle. (A-D) FISH analysis of nuclei stained with DAPI (blue) and hybridized with TARE6 (green) probe to visualize the chromosome ends on rings (A), trophozoites (B), schizonts (C) and aphidicolin-treated parasites (D). Scale bars: 1 μm. (E) Quantification of TARE6 FISH signals in rings, trophozoites and aphidicolin-treated parasites. n refers to the chromosome number per nucleus; in trophozoite stage, n>1, depending on the number of nuclear divisions that occurred on each individual parasite. In the case of aphidicolin-treated parasites, all signals (weak and strong) were counted. Error bars are 95% confidence intervals (±1.96 s.e.m.). The standard deviations for rings, aphidicolin-treated parasites and trophozoites are 1.20, 3.93 and 4.71, respectively. Mancio-Silva L, Rojas-Meza AP, Vargas M, Scherf A, Hernandez-Rivas R. Differential association of Orc1 and Sir2 proteins to telomeric domains in Plasmodium falciparum. J Cell Sci. 2008 PMID: 18525026.
