Parasite Culturing and Data Characteristics of the P. falciparum IDC Transcriptome Analysis
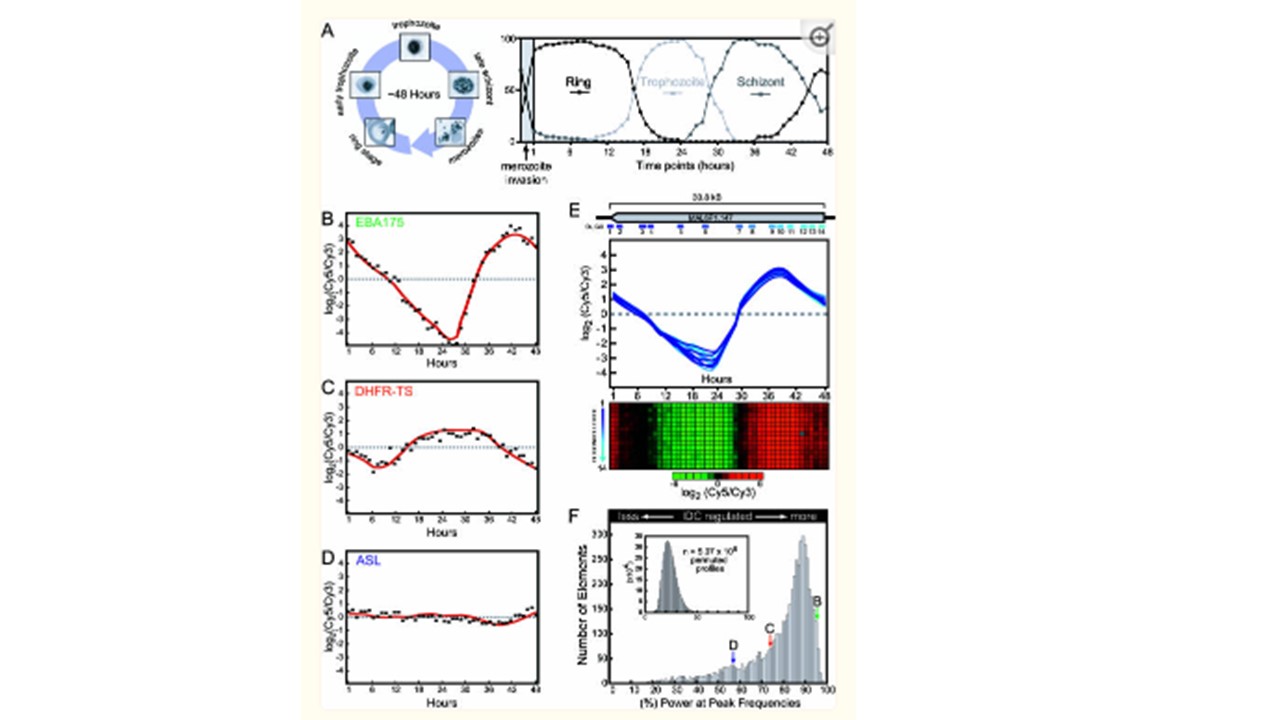
(A) Giemsa stains of the major morphological stages throughout the IDC are shown with the percent representation of ring-, trophozoite-, or schizont-stage parasites at every timepoint. The 2-h invasion window during the initiation of the bioreactor culture is indicated (gray area).
(B–D) Example expression profiles for three genes, encoding EBA175, DHFR-TS, and ASL, are shown with a loess fit of the data (red line).
(E) MAL6P1.147, the largest predicted ORF in the Plasmodium genome, is represented by 14 unique DNA oligonucleotide elements. The location of each of the oligonucleotide elements within the predicted ORF and the corresponding individual expression profiles are indicated (oligo 1–14). A red/green colorimetric representation of the gene expression ratios for each oligonucleotide is shown below the graph. The pairwise Pearson correlation for these expression profiles is 0.98 ± 0.02. (F) The percentage of the power in the maximum frequency of the FFT power spectrum was used as an indicator of periodicity. A histogram of these values reveals a strong bias toward single-frequency expression profiles, indicating that the majority of P. falciparum genes are regulated in a simple periodic manner. This bias is eliminated when the percent power was recalculated using random permutations of the same dataset (inset). For reference, the locations of EBA175 (peak B), DHFR-TS (peak C), and ASL (peak D) are shown. Bozdech Z, Llinás M, Pulliam BL, Wong ED, Zhu J, DeRisi JL. The transcriptome of the intraerythrocytic developmental cycle of Plasmodium falciparum. PLoS Biol. 2003 1(1):E5. PMID: 12929205
8