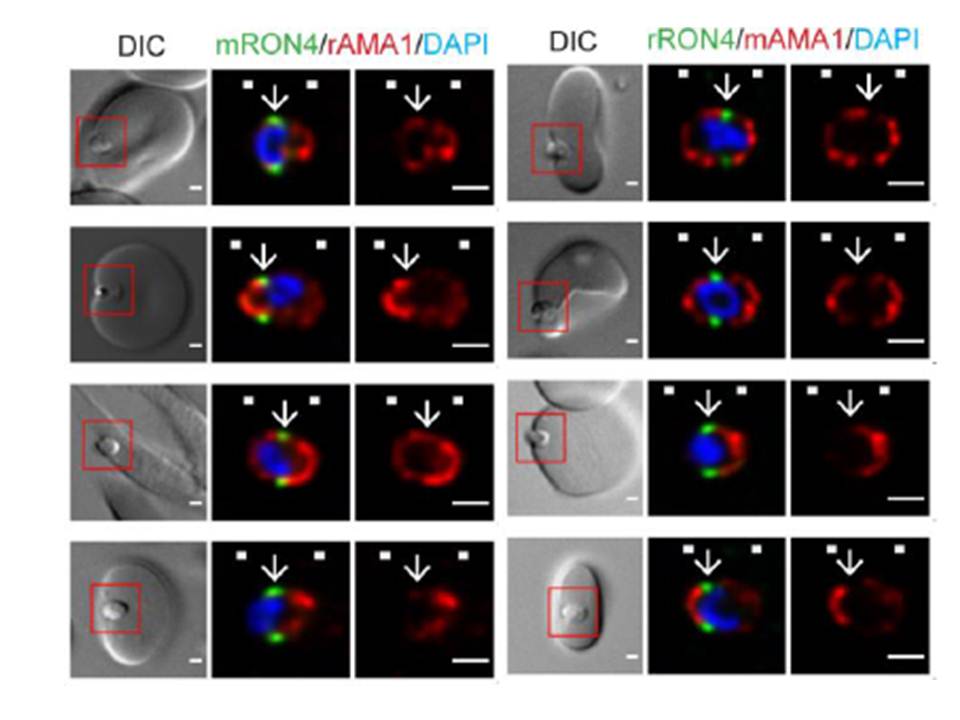
Longitudinal intensity profiling demonstrates antibody specific variation in AMA1 localisation at the tight junction. Single-slice images of example merozoites (left panel) mRON4 (green) vs rAMA1 (red) or(right panel) rRON4 (green) vs mAMA1 (red). Scale bars = 1 μm. Red boxes in DIC images indicate zoomed regions for middle and right panels. Arrows indicate the position of the RON4 labelled tight junction
Riglar DT, Whitehead L, Cowman AF, Rogers KL, Baum J. Localization-based imaging of malarial antigens during red cell entry reaffirms role for AMA1 but not MTRAP in invasion. J Cell Sci. 2015. [Epub ahead of print]
PubMed Article: Localisation-based imaging of malarial antigens during erythrocyte entry reaffirms a role for AMA1 but not MTRAP in invasion
Other associated proteins
| PFID | Formal Annotation |
|---|---|
| PF3D7_1133400 | apical membrane antigen 1 |