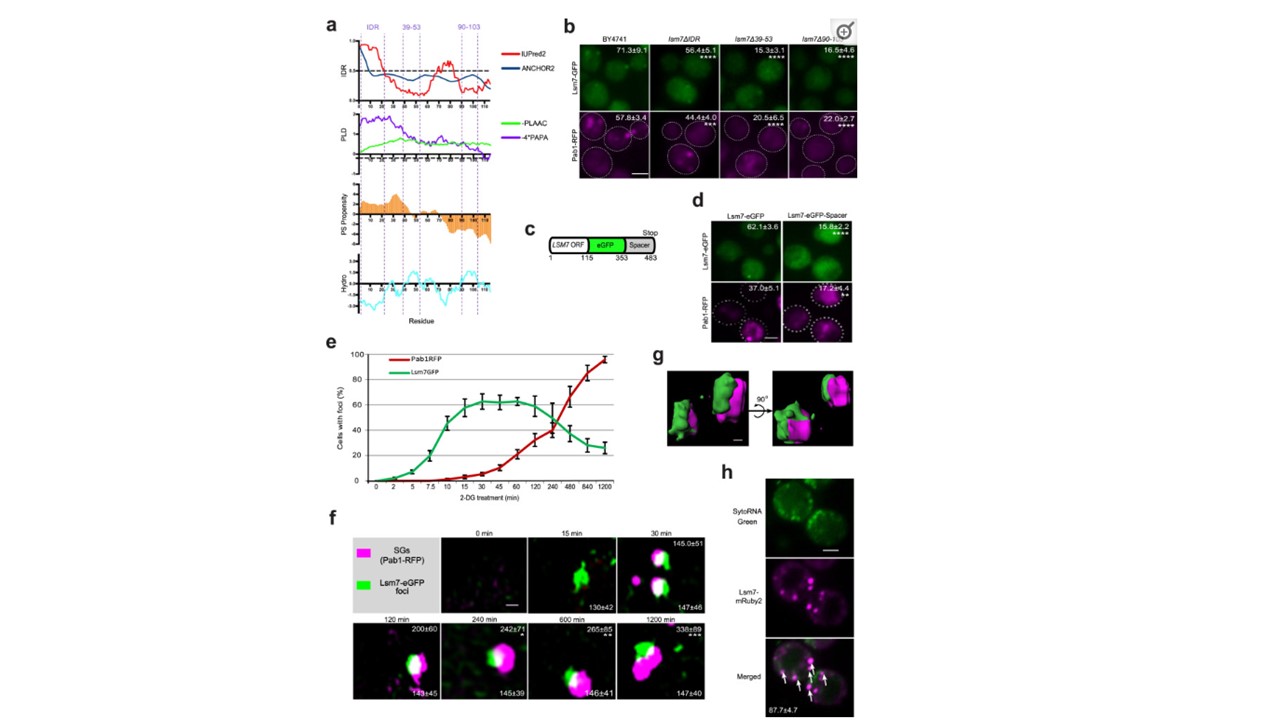
Lsm7 foci formation is needed to promote SG formation. If not stated otherwise, stress was induced by 2 h 2-DG treatment and scale bar indicates 2 µm. Values represent percentage of foci formation or co-localization and are shown as mean ± S.D. If not stated otherwise, >300 cells were analyzed for each biologically independent experiment. a Bioinformatic analysis of Lsm7’s phase separation potential. IDR; intrinsically disordered region prediction, IUPred2 (red, >0.5 regarded as IDR), ANCHOR2 (blue, >0.5 regarded as disordered binding region). PLD; prion-like domains prediction (PLAAC, green, <0 predicted as prion-like; PAPA, purple, <−0.02 or below the dashed line predicted as prion-like). PS propensity; LLPS propensity prediction (>0 treated as positive propensity). Hydro; hydrophobicity prediction (Kyte & Doolittle, >0 treated as hydrophobic). Lsm7 domains of interest are highlighted with dashed lines (IDR, amino acids 39-53 and 90-103). b Lsm7-GFP mutants exhibited significantly decreased Lsm7 foci (top) and SG formation (bottom) as compared to the WT (BY4741). Seven (BY4741, lsm7Δ39-53) and six (lsm7ΔIDR, lsm7Δ90-103) biologically independent experiments were examined and >200 cells were analyzed for each (two-way ANOVA followed by Dunnett’s multiple comparisons test, with individual variances computed for each comparison). ****p < 0.0001, ***p = 0.0001. c Construction of LSM7-eGFP-spacer strain. d Lsm7 foci (top) and SG formation (bottom) are significantly reduced in the spacer-tagged strain. Six biologically independent experiments were examined (unpaired two-tailed t-test). ****p < 0.0001, **p = 0.0014. e Lsm7 foci appear much earlier than SGs. Four biologically independent experiments were examined. f 3D-SIM shows the development process and co-localization structures of the Lsm7 foci and SGs. Scale bar indicates 250 nm. Values represent diameters (nm) of SGs (top) and Lsm7 foci (bottom) (mean ± S.D). Representative data for four biologically independent experiments (one-way ANOVA followed by Dunnett’s test, compared to the corresponding signal of the time-point 30 min). *p = 0.047, **p = 0.0089, ***p = 0.00021. g 3D-surface construction of Lsm7-eGFP and Pab1-RFP foci signals. Scale bar indicates 100 nm. h Lsm7 foci harbor RNA. White arrows indicate co-localizing RNA and mRuby2 foci. Representative images from three biologically independent experiments. Source data are provided as a Source Data file. Lindström M, Chen L, Jiang S, Zhang D, Gao Y, Zheng J, Hao X, Yang X, Kabbinale A, Thoma J, Metzger LC, Zhang DY, Zhu X, Liu H, Gustafsson CM, Burmann BM, Winderickx J, Sunnerhagen P, Liu B. Lsm7 phase-separated condensates trigger stress granule formation. Nat Commun. 2022 13(1):3701. PMID: 35764627
