Malaria Parasite Metabolic Pathways
RBC
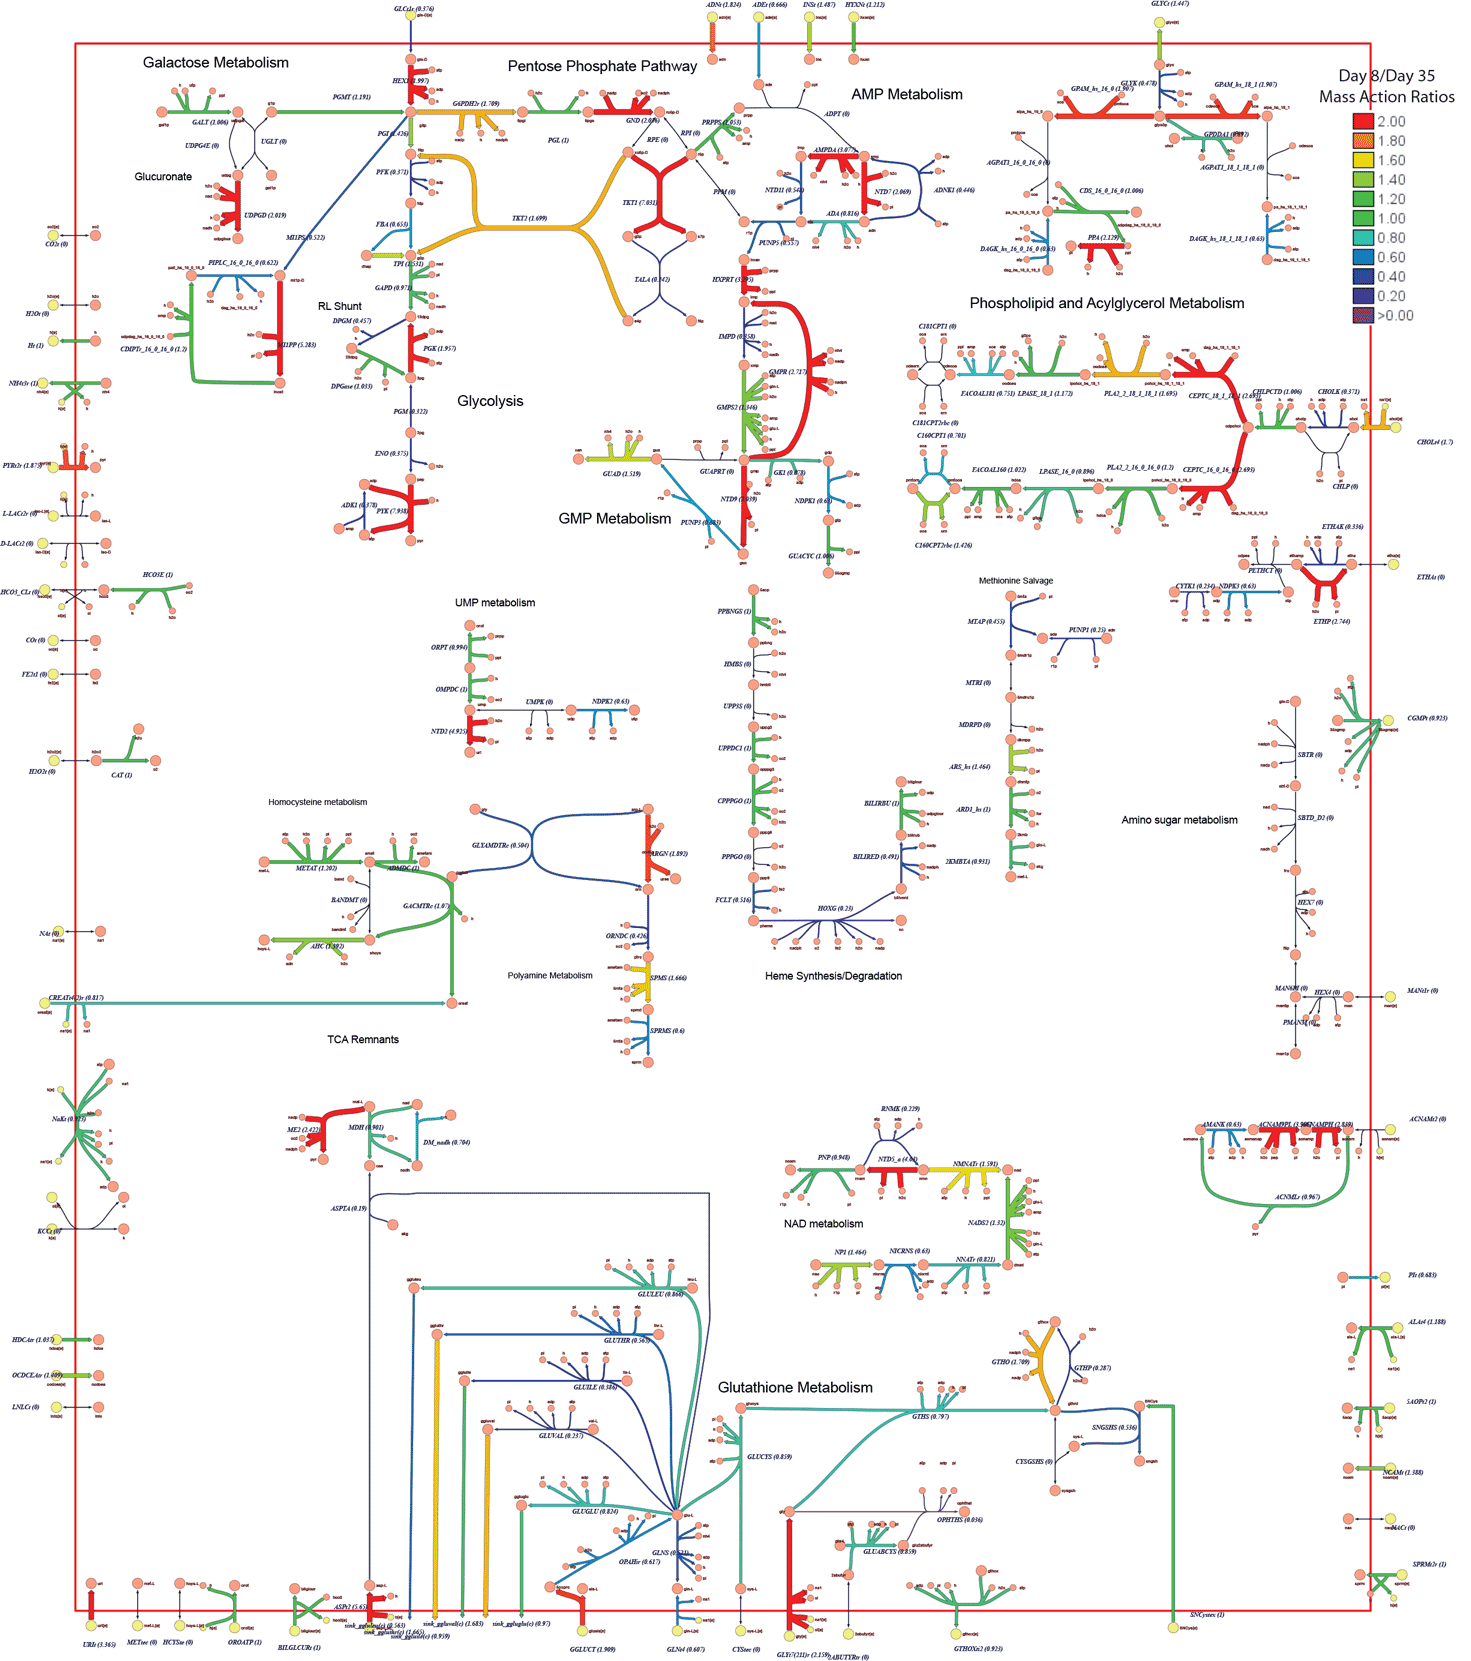
metabolic map highlighting systemic metabolic shifts during cellular
senescence. Reaction arrow thickness and color coding correspond to
relative Mass Action Ratios (rMAR) magnitude changes (day 8
versus day 35; all ratios greater than two are shaded red and black
is 0). Three subsystems of metabolism are highlighted, sugar
metabolism for energy (orange), amino acid/glutathione metabolism for
redox homeostasis (green), and fatty acid metabolism for
membrane/structural maintenance (pink). High rMAR reactions
(thick, red arrows, rMAR R2) reflect bottlenecks with
accumulation of enzyme substrates, identifying potential
‘‘age-limited’’ enzymes (the corresponding metabolites are
highlighted in blue text). Metabolic subsystems are labeled in
black font text.
Jamshidi N, Xu X, von Löhneysen K, Soldau K, Mohney RP, Karoly ED, Scott M, Friedman JS. Metabolome Changes during In Vivo Red Cell Aging Reveal Disruption of Key Metabolic Pathways. iScience. 2020 23(10):101630. PMID: 33103072
Please scroll down.
